![]()
CBSE Guess > Papers > Important Questions > Class XII > 2011 > Economics > Economics By Mr. Pranab Sharma
CBSE CLASS XII
Economics (Revision/Self Assessment test)
Page 1 of 11
- Suppose the relationship between a person's age and his or her height is plotted with the age measured along the x-axis and the height measured along the y-axis. Then, the curve showing this relationship is
A) a straight line with a positive slope.
B) positively sloped and becoming less steep.
C) a straight line with a negative slope.
D) negatively sloped and becoming less steep.
E) positively sloped and becoming more steep.
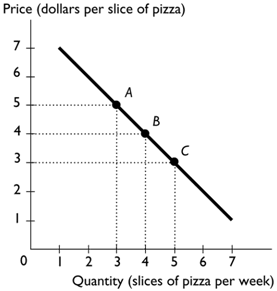
- The above figure shows the relationship between the price of a slice of pizza and how many slices of pizza Ricardo buys in a week. Between points A and B, the slope of the line equals
A) -5.
B) -4.
C) -3.
D) -1.
E) -2
- The above figure shows the relationship between the price of a slice of pizza and how many slices of pizza Ricardo buys in a week. Between points A and B, the slope of the line is ________ the slope of the line between points B and C.
A) greater than
B) equal to
C) less than
D) unrelated to
E) not comparable to

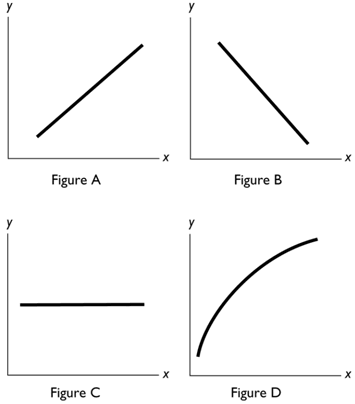
- In the above figure, which of the figures shows a relationship between x and y with a negative slope?
A) Figure A
B) Figure B
C) Figure C
D) Figure D
E) Both Figure A and Figure B
- In the above figure, which of the figures show(s) a relationships between x and y with a positive slope? A) Figure A and Figure D
B) Figure B and Figure C
C) Figure C only
D) Figure D only
E) Figure A and Figure B- When analyzing graphically the relationship between more than two variables, which of the following must be used? A) positive slope assumption
B) assumption of little change
C) ceteris paribus
D) negative slope assumption- The assumption that only relevant factors change Ceteris paribus when graphing a relationship refers to A) letting all the variables change at once.
B) changing the origin of the graph.
C) holding constant all but two variables.
D) rescaling the coordinates.- Swapping the axes so that the x-axis is the vertical axis and the y-axis is the horizontal axis On a graph showing the relationship between x and y, the ceteris paribus condition implies that A) no other variables are related to x and y.
B) the value of x is held constant.
C) the value of y is held constant.
D) other variables not shown are held constant.
E) the value of x and the value of y are held constant.- Three variables are related and two of them are plotted in a figure. If the variable that is not measured on either the x-axis or the y-axis changes, then there is A) a movement along the drawn curve.
B) a shift in the curve.
C) no impact on the curve because the variable is not measured on either of the axes.
D)either a shift in the curve or a movement along the curve but more information is needed to determine which.
E) None of the above answers are correct.- Suppose you decide to attend summer school and that this is considered a rational choice. When making this choice, A) you must ignore the problem of scarcity.
B) you considered the marginal cost and marginal benefit of your choice.
C) you have used the ceteris paribus assumption.
D) you have made a positive statement.
E) you must have considered the social interest.
Submitted By Mr. Pranab Sharma
Email Id : [email protected]

