- What is a random sample? (1 Marks)
- What is a Lorenz curve? (1 Marks)
- Define statistical series. (1 Marks)
- What is an index number? (1 Marks)
- What is a first step of a project? (1 Marks)
- “Statistics is both science as well as an art” Discuss The statement? (3 Marks)
- Define mode. How is it compute? (3 Marks)
- Write down the various measures of dispersion. (3 Marks)
- Compute the cost living index number using, aggregate expenditure method of the
Following information (3 Marks)
Commodities |
Q0 |
P0 |
P1 |
Whet |
20 |
10 |
12 |
Rise |
5 |
30 |
35 |
Ghee |
2 |
20 |
30 |
sugar |
4 |
25 |
40 |
OR
Write note on:
a) SENSEX
b) NIFTY
- Calculate median from the following data set. (3 Marks)
Mark in Hindi |
0-10 |
10-20 |
20-30 |
30-40 |
40-50 |
50-60 |
60-70 |
70-80 |
No. of students |
5 |
15 |
18 |
12 |
20 |
15 |
7 |
3 |
- What are the qualities of a good questionnaire? (4 Marks)
- Describe structure of project report. (4 Marks)
- Calculate mean and standard deviation from the following series. (4 Marks)
Mark in Hindi |
20-30 |
30-40 |
40-50 |
50-60 |
60-70 |
70-80 |
No. of students |
5 |
15 |
0 |
22 |
11 |
7 |
OR
Discuss the kinds and degrees of correlation?
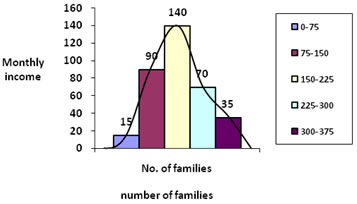
- Draw a histogram for the following data and also draw the frequency curve on it. (6 Marks)
Monthly income |
No. of families |
0-75 |
15 |
75-150 |
90 |
150-225 |
140 |
225-300 |
70 |
300-375 |
35 |
- A student subject 40 mark in English,65 in Hindi,53 in maths,49 in economics and 55 in statistics. Calculate weighted mean of the marks if weights are respectively 2, 1, 5, 5, and 3.
Or
Mention merits and demerits of Mean. And list out any three examples of ‘scope of averages in your class room’. (6 Marks)
- Following are the marks obtained by 10 students in two subjects, statistics and economics, calculate Spearman's rank correlation. (6 Marks)
Mark in statistics |
20 |
25 |
30 |
45 |
31 |
48 |
21 |
10 |
26 |
34 |
Mark in Economics |
5 |
19 |
20 |
42 |
21 |
47 |
20 |
10 |
12 |
33 |
- Its each and every unit of population has an equal chance of being selected. (1 Marks)
- Lorenz curve is a graphic method of measuring dispersions from the average. (1 Marks)
- Defined as things or attributes of things arranged according to some logical order. (1 Marks)
- Index number is a specialized averages designed to measure the changes in group of related variables over period of time.(1 Marks)
- Identification of problem.(1 Marks)
- Statistics is the numerical statement of facts---- science
Statistics evaluating social problems---- arts 1½ +1½ = (3 Marks)
- The mode is that value in a series of observations which occurs with the greatest frequency. (1 Marks)
Compute mode
- Individual series-which occurs maximum number items (repeated)
- Discrete series- value of greatest frequency
- ontinues series –using the formula
- Or explain with example give the mark 2 (1+2=3 Marks)
- Measures of dispersion.
- Range
- Quartile deviation
- Mean deviation
- Standard deviation
- Lorenz curve
- Any three 1x3=(3 Marks)
Commodities |
Q0 |
P0 |
P1 |
p0qo |
p1q0 |
Whet |
20 |
10 |
12 |
200 |
240 |
Rise |
5 |
30 |
35 |
150 |
175 |
Ghee |
2 |
20 |
30 |
40 |
60 |
sugar |
4 |
25 |
40 |
100 |
160 |
|
|
|
|
490 |
635 |
Aggregate expenditure method = 


=129.59
Inflation 29.59% 1+1+1 = (3 Marks)
Sensex
- Index of Bombay stock exchange
- Total 30 shares
- resent index above 20000
Nifty
- Index of national stock exchange
- Total 50 shares
- Present index above 5000 1½ +1½ = (3 Marks)
Mark in Hindi |
No. of students |
cf |
0-10 |
5 |
5 |
10-20 |
15 |
20 |
20-30 |
18 |
38 |
30-40 |
12 |
50 |
40-50 |
20 |
70 |
50-60 |
15 |
85 |
60-70 |
7 |
92 |
70-80 |
3 |
95 |
|
95 |
|
���������������������������������������������������
 1+1+1 =(3 Marks)
-
- Proper order of questions.
- Proper question number
- void unnecessary questions.
- imple and short questions.
- Any relevant answers. 1x4=(4 Marks)
- Introduction
- Statement of the problem
- Objectives
- Methodology
- Analysis of data
- Limitation of the study
- Conclusions. (4 Marks)
Mark in Hindi |
No. of students |
M |
MF |
d |
fd |
d² |
fd² |
20-30 |
5 |
25 |
125 |
-37 |
-185 |
1369 |
6845 |
30-40 |
15 |
35 |
525 |
-27 |
-405 |
729 |
10935 |
40-50 |
0 |
45 |
0 |
-17 |
0 |
289 |
0 |
50-60 |
22 |
55 |
1210 |
-7 |
-154 |
49 |
1078 |
60-70 |
11 |
65 |
715 |
3 |
33 |
9 |
99 |
70-80 |
7 |
75 |
525 |
13 |
91 |
169 |
1183 |
|
60 |
|
3100 |
|
-620 |
|
20140 |
 2+1+1 =(3 Marks)
Or
Kinds of correlation
- Positive and negative correlation
- Linier and non-linier correlation
- Simple, partial and multiple correlation
Degrees of correlation 2 + 2 = (4 Marks)
Perfect correlation |
1 (+ve or –ve ) |
Higher correlation |
99 to 75 (+ve or –ve ) |
Moderate correlation |
74 to 25 (+ve or –ve ) |
Lower correlation |
25 to 01 (+ve or –ve ) |
No correlation |
0 |
-
- ∑wx÷∑w
= 820÷16
= 51.25
Or Merit
a. Simplicity
b. Stability
c. Accuracy test
d. Any relevant answers.(ex)
Demerits
a. Unsuitability
b. Misleading conclusions
c. Effect of extreme items
d. Any relevant answers.(ex)
Scope of averages in class room
a. we can find average mark
b. it help formulation of policies
c. Find out average age, weight, height..Etc
d. Any relevant answers.(ex) (any three) 2+2+2 =( 6 Marks)
Mark in statistics |
Mark in Economics |
Rank in statistics |
Rank in Economics |
D |
D² |
20 |
5 |
9 |
10 |
1 |
1 |
25 |
19 |
7 |
7 |
0 |
0 |
30 |
20 |
5 |
5.5 |
0.5 |
0.25 |
45 |
42 |
2 |
2 |
0 |
0 |
31 |
21 |
4 |
4 |
0 |
0 |
48 |
47 |
1 |
1 |
0 |
0 |
21 |
20 |
8 |
5.5 |
2.5 |
6.25 |
10 |
10 |
10 |
9 |
1 |
1 |
26 |
12 |
6 |
8 |
2 |
4 |
34 |
33 |
3 |
3 |
0 |
0 |
|
|
|
|
|
12.5 |
= 
Positively high correlation